Heart Rate Variability (HRV): What It Really Tells You About Recovery

Your wearable shows you a small number every morning and calls it HRV. It is one of the most useful signals you own, and one of the most misread. HRV reflects how well your nervous system is balancing stress and recovery, but only if you read it the right way: as your own trend, not a scoreboard against other people. Here is what it measures, what it does not, and where cold water fits in.
The short answer
HRV is the tiny beat-to-beat variation in the time between your heartbeats, and it reflects how well your autonomic nervous system, mainly the calming vagal branch, is regulating your body. As a rule, higher resting HRV signals better autonomic balance and recovery capacity. But HRV is deeply individual, so your own baseline and its trend over time tell you far more than any single number or comparison to other people. Cold water immersion reliably causes a short-term rise in vagal HRV in the minutes afterward; a lasting increase in your resting baseline from regular cold plunging is plausible but not yet well proven.
In this article
- What is heart rate variability (HRV)?
- How is HRV different from your heart rate?
- What does HRV actually measure?
- Why does one number reflect every kind of stress?
- Should you track your HRV number or the trend?
- How does cold exposure affect HRV?
- How do you read your own HRV data?
- Which HRV metrics actually matter (RMSSD, SDNN, HF)?
What is heart rate variability (HRV)?
There’s a number on your wrist right now that tracks, with real usefulness, how well you are recovering, how ready you’ll be for tomorrow’s workout, and whether that stressful meeting yesterday left a physiological mark your conscious mind didn’t register. It’s not your step count. It’s not your calories burned. It’s a number most people glance at and scroll past because nobody taught them what it means or why it matters more than almost everything else their wearable tracks.
The number is heart rate variability , HRV. And the gap between what this metric actually represents and what most wearable owners understand about it is, arguably, the single largest missed opportunity in consumer health technology.
This article is about closing that gap. Not with technical jargon, but with a framework that makes HRV intuitively legible , one that transforms it from a confusing number into a decision-making tool for sleep, training, stress, recovery, and every other intervention in this library. Because here’s the thing about HRV: it doesn’t just respond to cold plunges, fasting, and sleep. It shows you whether they’re working.
How is HRV different from your heart rate?
The first and most important thing to understand: heart rate variability is not heart rate. Heart rate tells you how many times your heart beats per minute. HRV measures the variation in the time interval between consecutive heartbeats. And as counterintuitive as it sounds, more variation is better.
A heart beating at 60 beats per minute is not beating once per second, metronomically. In a healthy, recovered individual, the intervals fluctuate , 0.98 seconds, then 1.04, then 0.96, then 1.02. These differences are measured in milliseconds. They are invisible to you. And they are governed by something profound: the real-time tug-of-war between the two branches of your autonomic nervous system.
Shaffer and Ginsberg’s 2017 review in Frontiers in Public Health , one of the most cited papers in the field , summarized the principle concisely: a healthy heart is not a metronome. The oscillations of a healthy heart are complex and constantly changing, allowing the cardiovascular system to rapidly adjust to sudden physical and psychological challenges. Variability is not noise. It is the signal of a system with the capacity to respond.
What you already knew: “HRV is something my watch tracks.” Vaguely related to recovery.
What the science adds: HRV is governed by the balance between the sympathetic nervous system (fight-or-flight , accelerates heart rate, narrows beat-to-beat intervals) and the parasympathetic nervous system (rest-and-digest , slows heart rate, widens intervals). When parasympathetic tone dominates, intervals vary more. When sympathetic tone dominates, the heart locks into a rigid, metronomic cadence. The metric most wearables report , RMSSD (root mean square of successive differences) , directly quantifies this parasympathetic influence. High RMSSD means high variability means high parasympathetic tone means: recovered, resilient, adaptable.
The new understanding: HRV integrates every stressor acting on your body , sleep quality, training load, emotional stress, nutrition, illness, alcohol , into a single number. Not because it measures those things directly, but because all of them act through the autonomic nervous system, and HRV is a window into autonomic balance. It is the closest thing you have to a real-time readout of total system resilience.
What does HRV actually measure?
The most useful way to think about HRV is as the suspension on a car. Good suspension (high HRV) means the car handles potholes, sharp turns, and rough roads smoothly , it absorbs impact and adapts. Bad suspension (low HRV) means every bump rattles the entire frame. The road is the same. The car’s capacity to absorb what the road throws at it is what changes.
Your HRV tells you the current state of your suspension. And crucially, the “road” isn’t just physical. A fight with your partner, a night of poor sleep, an extra glass of wine, a hard training session, a looming deadline , all of these degrade your suspension. Rest, sleep, cold exposure, good nutrition , all of these rebuild it. HRV is the meter that shows you where you stand.
Why does one number reflect every kind of stress?
Here’s where HRV becomes genuinely powerful as a self-knowledge tool. Every stressor acting on your body , physical, psychological, metabolic, environmental , passes through the autonomic nervous system. And HRV captures the net effect of all of them simultaneously.
This integration property is what makes HRV uniquely valuable. Consider: after a hard training session, your HRV will drop (sympathetic dominance from physical stress). After a good night’s sleep, it will recover (parasympathetic restoration). But what if you had a bad training session and a stressful day and drank alcohol that night? Your HRV captures the cumulative impact of all three , and it does so without you having to track each variable separately. This is what Buchheit’s 2014 review established: HRV doesn’t tell you which stressor is acting. It tells you the total load on the system versus the system’s current recovery capacity.
Should you track your HRV number or the trend?
Here is the second critical insight that separates people who understand HRV from people who merely track it.
What you already knew: “My HRV was 42 this morning.” A number you checked and either felt good or bad about.
What the science adds: A single HRV reading is nearly meaningless. It fluctuates with hydration, sleeping position, room temperature, time of measurement, and random noise. Plews et al. demonstrated that weekly-averaged HRV values correlate strongly with training adaptation and performance changes in elite athletes, while isolated daily readings do not. The signal is in the 7-day rolling average.
The new understanding: A declining 7-day HRV trend , even if individual daily readings seem acceptable , signals that your total allostatic load (the cumulative wear of all stressors) is exceeding your recovery capacity. This is the “check engine” light most people don’t know how to read. Conversely, a rising trend means your recovery inputs (sleep, nutrition, rest, cold exposure) are winning the battle against your stressors. The day-to-day number is noise. The weekly trend is the signal. Train the trend, not the number.
Plews et al. found that in elite athletes, the variation of the variation , the coefficient of variation (CV) of daily HRV , was itself a meaningful metric. Athletes whose HRV was highly variable day-to-day (high CV) tended to underperform compared to those with more stable, consistently high HRV (low CV). The implication: consistency of recovery matters as much as magnitude of recovery. The goal isn’t a few great nights. It’s a lifestyle that keeps the signal stable and trending upward.
How does cold exposure affect HRV?
This is where every thread in the Cool Bionic library converges into a single, measurable outcome.
Regular cold exposure , the kind described in our cold plunge protocol articles , produces a consistent, measurable effect on HRV over time. The acute response is a transient sympathetic surge (heart rate rises, HRV drops temporarily). In the minutes after you get out, the pendulum swings the other way: cold immersion produces a well-documented acute rebound in vagal, parasympathetic HRV that can last around fifteen minutes. Whether habitual cold plunging lifts your resting baseline HRV for good is plausible but not yet proven, since the controlled long-term evidence is still thin and people who plunge regularly may simply have started with healthier hearts. The acute rebound, though, is real, and it is the part the evidence clearly supports.
The mechanism connects directly to what we described in the hormesis article: cold is a controlled stressor that trains the autonomic nervous system to recover more efficiently. Each exposure practices the sympathetic → parasympathetic transition. Over weeks, the system gets faster and more complete in its recovery. The result shows up on your wrist , not as a vague “readiness score,” but as a measurable, trending increase in RMSSD.
This is the practical power of understanding HRV: you can see the effect of your interventions in real data. Start a consistent cold plunge practice and track your 7-day HRV average over 4-6 weeks. Improve your sleep consistency and watch the trend. Cut alcohol for 30 days and observe what happens. HRV turns abstract health behaviors into a visible, quantified feedback loop. You’re not guessing whether something works. You’re measuring it , using the same metric that sports scientists use to monitor elite athletes.
How do you read your own HRV data?
Understanding HRV at a conceptual level is necessary. Understanding how to read your own data is what makes it useful. Here are the practical principles from the sports science literature that translate directly to personal use.
Measure at the same time every day. HRV follows a circadian pattern. The only way to compare day-to-day is to control the timing. First thing upon waking, before getting out of bed, is the gold standard for consumer measurement. Most wearables that track HRV during sleep use the last stable period of the night, which is a reasonable proxy.
Ignore single-day readings. An HRV of 38 one morning doesn’t mean you’re overtrained. An HRV of 65 the next morning doesn’t mean you’re recovered. The variability of the metric itself is part of its nature. React to the 7-day trend, not the daily number.
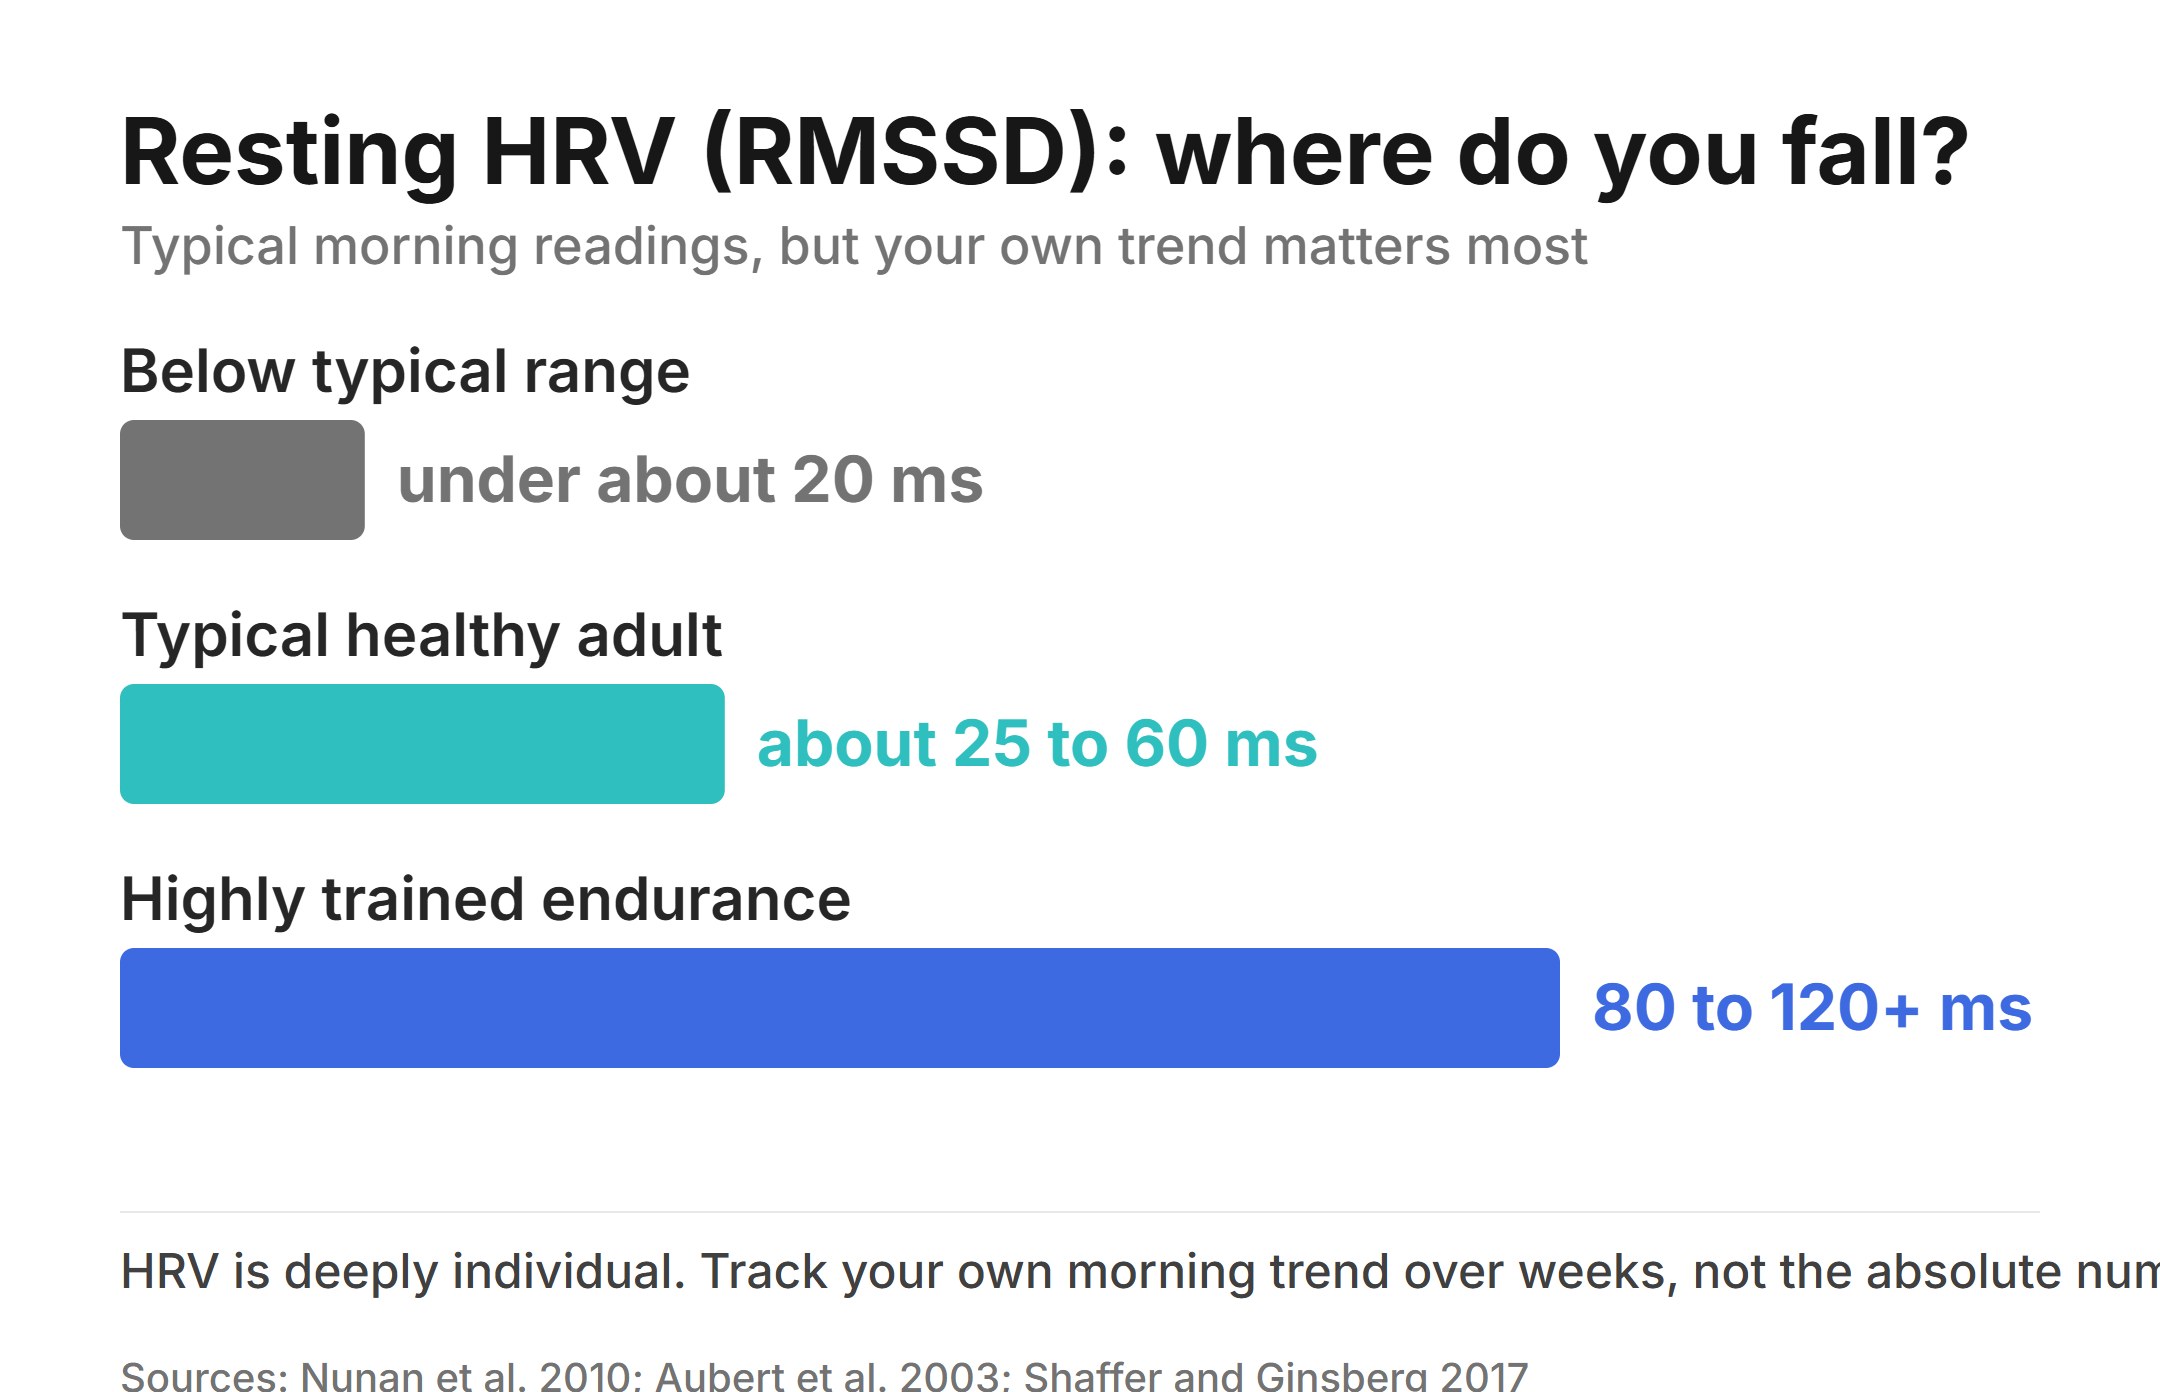
Your baseline is personal. An HRV of 45 might be excellent for a 50-year-old executive and concerning for a 25-year-old endurance athlete. Population norms exist but are largely irrelevant for individual monitoring. What matters is your trend relative to your baseline. Establish 2-3 weeks of consistent measurement to find your personal baseline, then track deviations.
There is an irony in HRV monitoring: obsessing over the number creates the very stress that suppresses it. If checking your morning HRV generates anxiety about whether it’s “good enough,” you are using the tool against yourself. The metric exists to inform macro-level decisions , whether to push or recover this week, whether a protocol is working over months , not to micromanage individual hours. Measure consistently. Review weekly. Act on trends. Then put the phone down.
Which HRV metrics actually matter (RMSSD, SDNN, HF)?
HRV is the headline metric , the one number that integrates the most information. But a complete data-driven wellness practice includes a small number of complementary signals that, together, give you a remarkably complete picture of your physiological state.
The key insight from Buchheit’s review: no single metric tells the whole story. But HRV + resting heart rate + subjective wellness , tracked consistently , provides a monitoring system comparable to what professional sports science teams use. The tools are already on your wrist. The framework above is what makes them legible.
A healthy heart is not a metronome. The oscillations of a healthy heart are complex and constantly changing.
Every intervention in this library , cold exposure, fasting, sleep optimization, hormetic stress , ultimately works through the autonomic nervous system. And HRV is the window into that system’s state. It doesn’t replace the practices. It shows you whether they’re working, in your body, in real time.
Start a cold plunge practice and watch your 7-day average climb over weeks. Fix your sleep schedule and watch the trend stabilize. Compress your eating window and observe the morning readings. The body responds to these inputs with measurable, trackable changes in autonomic balance. You don’t have to take anyone’s word for it. Your data will show you.
The number on your wrist has always been there. Now you know what it means. Not just a metric. A mirror.
Frequently asked questions
What is a good HRV number?
There is no universal good number. Typical morning RMSSD for healthy adults sits roughly between 25 and 60 ms, and highly trained endurance athletes often read higher, but HRV varies enormously between people. Your own baseline and whether it is trending up or down over weeks is what matters, not how you compare to someone else.
Is a higher HRV always better?
Generally a higher resting HRV signals better autonomic balance and recovery capacity. But a sudden jump is not automatically good, and a single low reading is not a crisis. Look at the trend over days and weeks, and read it alongside how you actually feel, sleep, and train.
How do I measure HRV reliably?
Measure at the same time each day, ideally first thing in the morning before you get up, so you are comparing like with like. A wrist or ring wearable is fine for tracking your own trend. The clinical reference window is a 5-minute recording, but consistency of timing matters more than the device.
Does cold water raise your HRV?
In the short term, yes. Cold immersion triggers a vagal, parasympathetic rebound that raises HRV for roughly fifteen minutes afterward. Whether doing it regularly lifts your resting baseline over the long term is plausible but not yet proven by controlled studies, so treat the acute effect as the reliable one.
Can HRV diagnose illness?
No. HRV is a recovery and readiness signal, not a diagnostic instrument. Low HRV can flag that your body is under load, but it does not diagnose any condition, and consumer wearable readings are not medical measurements. See a doctor for anything health related.
Give your nervous system something to respond to
The clearest HRV signal cold water produces is the acute vagal rebound in the minutes after you get out. A controlled, repeatable session makes that response easy to feel and to track. The Vitalis 3 holds any set point from 2 to 40°C, so you can dial the same dose each day and watch how your morning trend responds.
- Shaffer F, Ginsberg JP (2017). An overview of heart rate variability metrics and norms. Frontiers in Public Health 5:258. doi.org/10.3389/fpubh.2017.00258
- Shaffer F, McCraty R, Zerr CL (2014). A healthy heart is not a metronome: an integrative review of the heart’s anatomy and heart rate variability. Frontiers in Psychology 5:1040. doi.org/10.3389/fpsyg.2014.01040
- Task Force of the ESC and NASPE (1996). Heart rate variability: standards of measurement, physiological interpretation and clinical use. Circulation 93(5):1043-1065. doi.org/10.1161/01.CIR.93.5.1043
- Nunan D, Sandercock GRH, Brodie DA (2010). A quantitative systematic review of normal values for short-term heart rate variability in healthy adults. Pacing Clin Electrophysiol 33(11):1407-1417. doi.org/10.1111/j.1540-8159.2010.02841.x
- Aubert AE, Seps B, Beckers F (2003). Heart rate variability in athletes. Sports Medicine 33(12):889-919. doi.org/10.2165/00007256-200333120-00003
- Plews DJ, Laursen PB, Stanley J, Kilding AE, Buchheit M (2013). Training adaptation and heart rate variability in elite endurance athletes. Sports Medicine 43(9):773-781. doi.org/10.1007/s40279-013-0071-8
- Buchheit M (2014). Monitoring training status with HR measures: do all roads lead to Rome? Frontiers in Physiology 5:73. doi.org/10.3389/fphys.2014.00073
- Stanley J, Peake JM, Buchheit M (2013). Cardiac parasympathetic reactivation following exercise. Sports Medicine 43(12):1259-1277. doi.org/10.1007/s40279-013-0083-4
- Buchheit M, Peiffer JJ, Abbiss CR, Laursen PB (2009). Effect of cold water immersion on postexercise parasympathetic reactivation. Am J Physiol Heart Circ Physiol 296(2):H421-H427. doi.org/10.1152/ajpheart.01017.2008
- Dekker JM, Schouten EG, Klootwijk P, et al. (1997). Heart rate variability from short recordings predicts mortality from all causes in middle-aged and elderly men (Zutphen Study). Am J Epidemiol 145(10):899-908. doi.org/10.1093/oxfordjournals.aje.a009049